Dubai Islands Property Investment: Nakheel Waterfront
Dubai Islands (formerly Deira Islands) investment guide, Nakheel ~90% delivery, waterfront off-plan pricing, yield projections
By Invest Gulf Editorial · Updated June 11, 2026 · 9 min read
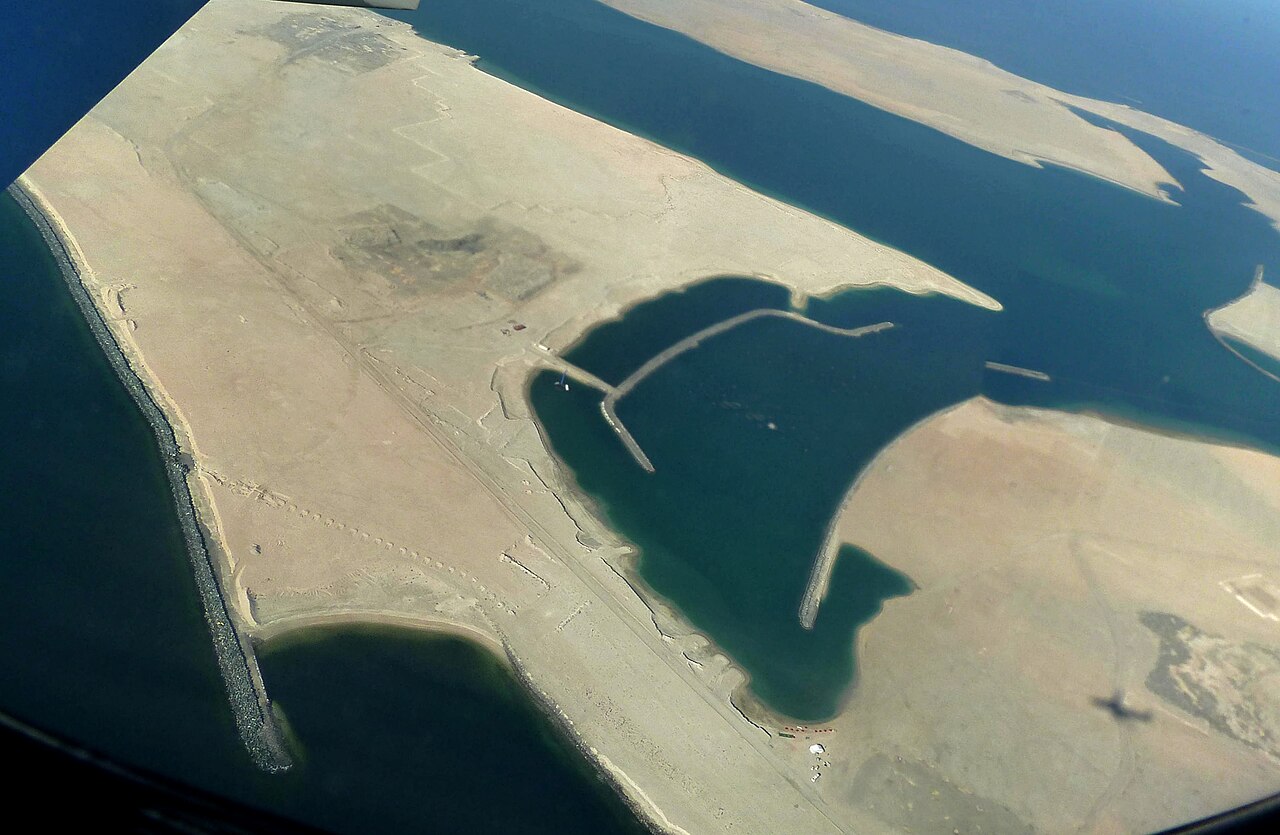
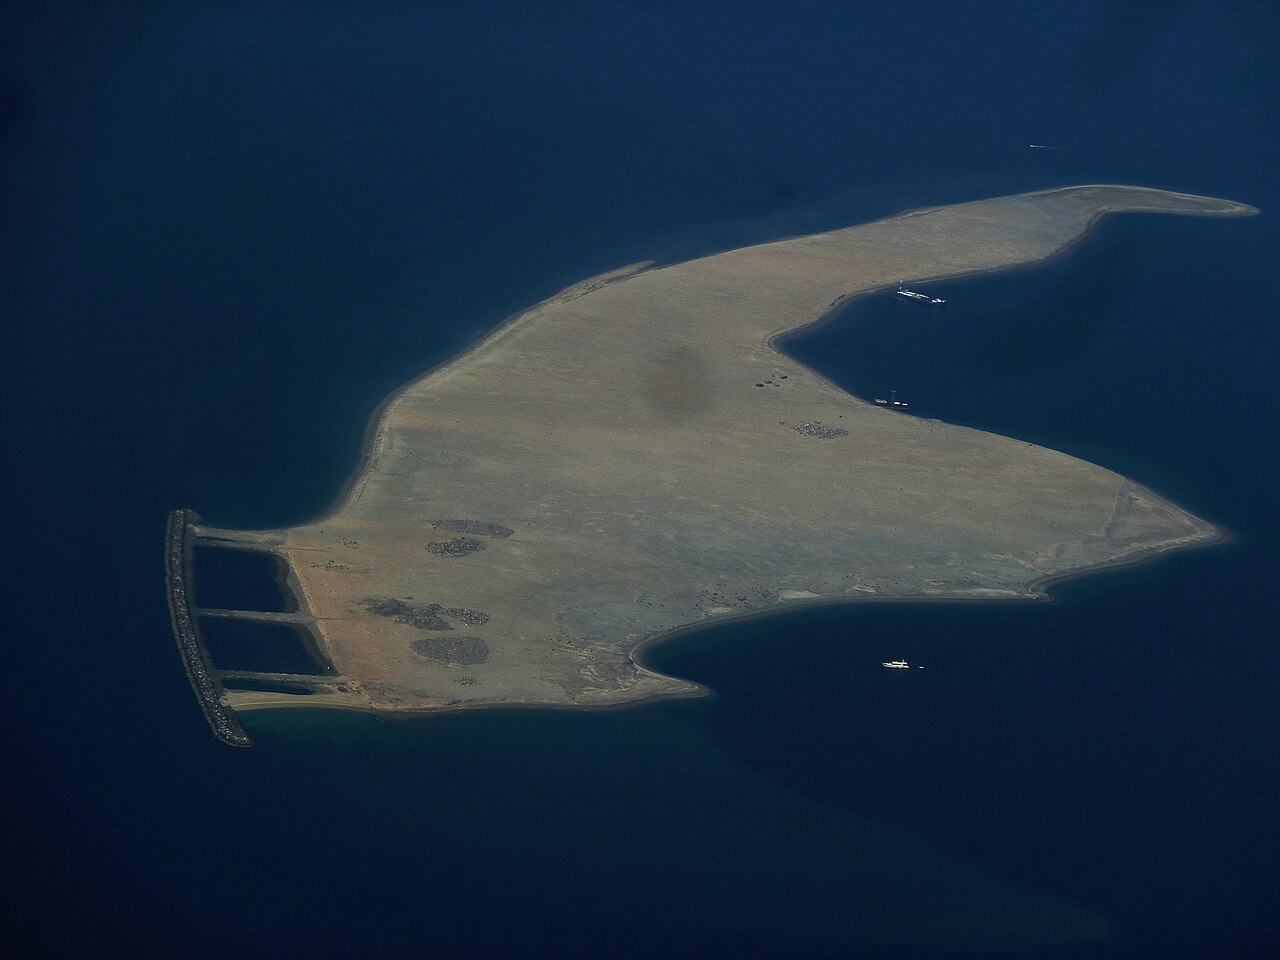
Dubai Islands is Nakheel’s relaunched waterfront master plan, five islands off the Deira coast, formerly known as Deira Islands, now repositioned as a mixed-use residential and hospitality destination spanning 17 sq km. For investors in 2026, the community is overwhelmingly an off-plan and long-horizon proposition: limited delivered stock, early-stage rental data, and a thesis that depends on Nakheel executing a master plan comparable in ambition to Palm Jumeirah.
Market context developer data: Nakheel delivers ~90% on time, government-backed, with Palm Jumeirah and waterfront expertise. That credibility supports off-plan confidence, but 90% is not 95% (Emaar), and Dubai Islands’ rental market does not yet exist at scale.
Quick answer: Predominantly off-plan. Projected gross 6.0–7.5% (speculative). Nakheel freehold. Plan 7–10 year hold. Compare ready-stock option: Dubai Creek Harbour.
See Best Areas to Buy Property in Dubai and Off-Plan Property Dubai Guide.
Dubai Islands: 2026 investment snapshot
| Metric | Dubai Islands | Creek Harbour | Palm Jumeirah (apt) |
|---|---|---|---|
| Development stage | Early / off-plan heavy | Phase 1 delivered | Mature |
| Developer | Nakheel (~90%) | Emaar (~95%) | Nakheel (~90%) |
| Delivered stock | Limited | Substantial | Extensive |
| Projected gross yield | 6.0–7.5% (early) | 5.5–7.0% (verified) | 4–6% (verified) |
| Freehold (foreign) | Yes | Yes | Yes |
| Re-sale liquidity | Early / thin | Growing | Strong (prime) |
| STR potential | Future / unproven | Low-moderate | Very high (crescent) |
Dubai recorded 205,000+ transactions in 2025 with off-plan at 60–70% of volume. Dubai Islands captures Nakheel’s share of that off-plan pipeline.
The Nakheel track record
| Developer metric | Nakheel |
|---|---|
| Delivery rate | ~90% |
| Government backing | Dubai Holding |
| Waterfront expertise | Palm Jumeirah, The World, Jumeirah Islands |
| NOC fee (resale) | AED 1,050 |
| Key risk | Large master plans with long execution timelines |
Nakheel built Palm Jumeirah, the most recognised waterfront development in the Gulf. Dubai Islands is the next-generation attempt with updated urban planning, sustainability requirements, and a residential mix targeting mid-market to premium buyers priced below Palm entry.
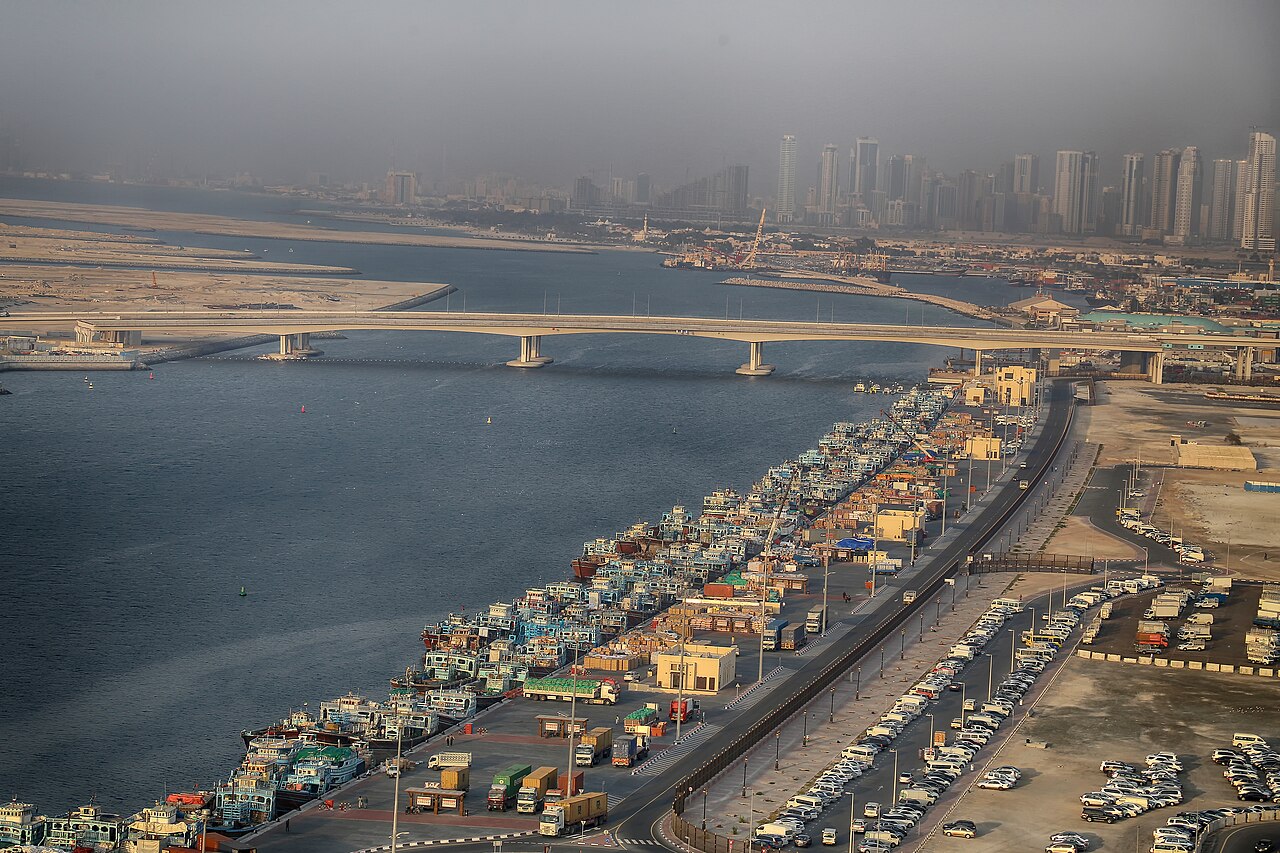
Location thesis: Deira coast and Dubai Creek proximity
Dubai Islands’ geographic argument:
- Historic Deira adjacency, access to Gold Souk, Dubai Creek, and old Dubai cultural assets
- Creek Harbour proximity, complementary waterfront communities 10–15 minutes apart
- Airport access, Dubai International Airport 15–20 minutes
- No Palm premium, entry pricing targets buyers who want waterfront without Palm Jumeirah tickets
Chinese buyers (5–7%, AED 2.1M average) and UK buyers (8–17%, AED 2.5–3.2M) drive waterfront demand in Dubai based on current market notes nationality data. Dubai Islands targets this segment at lower entry than Palm or Downtown.
Off-plan economics in 2026
Dubai Islands is primarily an off-plan market. Market context off-plan rules apply:
| Cost / rule | Detail |
|---|---|
| DLD transfer | 4% at Oqood registration |
| Escrow | Mandatory, verify on Dubai REST |
| Developer commission | Typically paid by developer on off-plan |
| Legal review | AED 5,000–15,000 recommended |
| Total buyer acquisition (cash, ready) | ~6–9% above price |
Payment plan structures from Nakheel typically span construction period plus post-handover installments. Capital remains locked until handover and potentially beyond, model internal rate of return on equity deployed, not headline yield.
Yield modelling: conservative approach
Without established Ejari data, use proxy communities:
| Proxy | Gross yield | Applicability |
|---|---|---|
| Palm Jumeirah apartments | 4–6% | Premium segment ceiling |
| Jumeirah Islands | 5–6.5% | Nakheel waterfront mid-premium |
| Discovery Gardens | 7.5–8.8% | Mid-market Nakheel (older stock) |
| Creek Harbour Phase 1 | 5.5–7.0% | Closest geographic comparable |
Apply 8–12% vacancy (supply-heavy emerging community band based on current market notes) until occupancy data proves otherwise. Service charges: model AED 14–20 per sq ft from comparable Nakheel residential stock.
Product mix: apartments, townhouses, villas
Nakheel’s master plan spans:
- Waterfront apartments, primary investor product, studios to three-bedroom
- Townhouses, family end-user target, limited early inventory
- Villas, premium waterfront, Golden Visa threshold likely in single unit
- Hospitality-branded residences, potential STR overlay if hotel operator attached
Investor focus in 2026 should be apartments with the shortest handover timeline and clearest escrow registration, liquidity on exit depends on delivered, occupied buildings.
Golden Visa consideration
AED 2 million registered value qualifies for UAE Golden Visa. Dubai Islands premium two-bedroom and three-bedroom units may approach this threshold at launch pricing, confirm registered Oqood value, not marketing price.
Rules: registered value counts with UAE mortgage NOC; DLD fees excluded from qualifying amount. See UAE Golden Visa Property 2026.
Dubai Islands vs Creek Harbour: investor decision
| Factor | Dubai Islands | Creek Harbour |
|---|---|---|
| Delivered rental data | Minimal | Phase 1 established |
| Developer delivery | Nakheel ~90% | Emaar ~95% |
| Entry price (off-plan) | Lower | Higher |
| Infrastructure | Building | Phase 1 operational |
| Hold horizon | 7–10 years | 5–7 years |
| Risk profile | Higher (earlier stage) | Moderate (maturing) |
Choose Creek Harbour if you want verified yield data and Emaar delivery on ready or near-ready stock. Choose Dubai Islands if you want earlier waterfront entry, accept off-plan risk, and hold 7–10 years.
Red flags
- Marketing yield without Ejari backup: treat all pre-handover yield claims as speculative.
- Non-escrow projects: only DLD-regulated escrow is legitimate, verify on Dubai REST.
- Ignoring master plan timeline: Nakheel large-scale projects take years to reach critical occupancy mass.
- Service charge estimates: Nakheel actuals on Palm and Jumeirah Islands run AED 20–40/sqft on premium stock, do not assume mid-market charges on waterfront product.
- Off-plan premium to ready waterfront: if comparable ready stock exists in Creek Harbour at similar price, ready may be the cleaner buy.
Who should invest in Dubai Islands
Dubai Islands suits investors who:
- Believe in Nakheel waterfront execution at below-Palm pricing
- Accept 7–10 year capital lock-up on off-plan
- Want freehold waterfront exposure in an early-stage master plan
- Can verify escrow and model conservative net yield
Not suited to: income investors needing cash flow within 24 months, buyers requiring established resale liquidity, or risk-averse investors who prefer Emaar’s 95% delivery benchmark.
Nakheel payment plan structures
Dubai Islands off-plan typically follows Nakheel’s construction-linked payment schedule:
| Phase | Typical payment | Cumulative |
|---|---|---|
| Booking | 10–20% | 10–20% |
| Foundation | 10% | 20–30% |
| Structure | 10–15% | 35–45% |
| Handover | 20–30% | 55–75% |
| Post-handover | 25–45% over 2–3 years | 100% |
Post-handover obligations reduce cash yield until fully paid, model return on equity deployed during the payment period, not headline property price.
Second worked example: conservative post-handover model
Assume AED 900,000 apartment delivers at handover with AED 55,000 projected gross rent:
| Item | Amount |
|---|---|
| Purchase price | AED 900,000 |
| Annual rent (conservative) | AED 55,000 |
| Gross yield | 6.1% |
| Service charges (AED 16 × 750 sq ft) | AED 12,000 |
| Management (6%) | AED 3,300 |
| Vacancy (10%, emerging community) | AED 5,500 |
| Maintenance | AED 1,500 |
| Net income | AED 32,700 |
| Net yield | 3.63% |
At 10% vacancy and conservative rent, net yield compresses significantly below developer marketing, this is the realistic base case until Ejari depth builds.
Infrastructure timeline and catalysts
| Catalyst | Status (2026) | Investor impact |
|---|---|---|
| Phase 1 residential handovers | Underway | First Ejari data emerging |
| Deira connectivity bridges | Planned/in progress | Commute improvement |
| Hospitality anchors | Announced | STR potential long-term |
| Retail and F&B precinct | Early stage | Tenant amenity depth |
Each infrastructure milestone should improve occupancy and resale liquidity, but on Nakheel master-plan timelines measured in years, not quarters.
Cross-emirate waterfront comparison
| Community | Stage | Verified gross yield | Hold horizon |
|---|---|---|---|
| Dubai Islands | Early off-plan | 6.0–7.5% (projected) | 7–10 years |
| Creek Harbour | Phase 1 delivered | 5.5–7.0% | 5–7 years |
| Palm Jumeirah (apt) | Mature | 4–6% | 3–5 years |
| Jumeirah Islands | Mature | 5–6.5% | 3–5 years |
Dubai Islands offers earlier entry pricing than Creek Harbour Phase 1 at comparable handover stages, with higher execution risk and less rental data.
Due diligence checklist for off-plan buyers
Before signing any Dubai Islands SPA, complete this verification sequence:
- Confirm RERA escrow registration on Dubai REST: reject any non-escrow project
- Review Nakheel delivery history for comparable projects (Palm, Jumeirah Islands)
- Obtain independent legal review (AED 5,000–15,000): non-negotiable for off-plan
- Model service charges from Palm Jumeirah apartment comparables, not developer estimates
- Calculate IRR on equity deployed including post-handover payment obligations
- Plan exit strategy assuming 7–10 year hold minimum
Nakheel’s government backing through Dubai Holding provides institutional credibility, but large master plans require patient capital. Treat Dubai Islands as a portfolio allocation, not a liquidity vehicle.
Dubai Islands development phasing and investment timing
Understanding Nakheel’s development sequence is crucial for investment timing optimization:
Phase 1: Foundation infrastructure (2024–2027)
| Infrastructure element | Timeline | Investment impact |
|---|---|---|
| Bridge connectivity | 2025–2026 | Accessibility unlock |
| Utilities backbone | 2025–2026 | Construction enablement |
| First residential clusters | 2026–2027 | Rental market establishment |
| Beach access points | 2026–2027 | Lifestyle amenities baseline |
Investment window: Phase 1 launch pricing before infrastructure completion offers maximum appreciation potential but requires longest hold period.
Phase 2: Community establishment (2027–2030)
| Milestone | Timeline | Property value impact |
|---|---|---|
| First retail and F&B | 2027–2028 | Community livability |
| Beach club facilities | 2028–2029 | Premium tenant attraction |
| Hotel anchor opening | 2029–2030 | STR market activation |
| School and healthcare | 2030+ | Family market depth |
Investment window: Phase 2 entry captures community maturation with shorter wait for amenities.
Phase 3: Maturity and optimization (2030+)
Full community build-out creates established rental market comparable to other Dubai waterfront communities.
Investment consideration: Phase 3 entry provides immediate lifestyle but limited appreciation upside versus earlier phases.
Rental yield projections across Dubai Islands development
Given limited historical data, yield projections draw from comparable Dubai waterfront communities:
Yield evolution timeline
| Development year | Projected gross yield | Market characteristics | Comparable precedent |
|---|---|---|---|
| Years 1–2 (handover) | 7–9% | Limited stock, high demand | Creek Harbour Phase 1 |
| Years 3–5 (establishment) | 6–8% | Increased supply, maturing market | Jumeirah Golf Estates |
| Years 6–10 (maturity) | 5–7% | Balanced supply-demand | Palm Jumeirah apartments |
| Years 10+ (established) | 4.5–6.5% | Mature community, capital focus | Jumeirah Islands |
Yield compression factors over time:
- New supply delivery reducing rental scarcity premiums
- Price appreciation outpacing rental growth
- Competition from other waterfront developments
- Tenant market maturation reducing willingness to pay location premiums
Unit type yield differentials
| Unit type | Projected yield range | Target tenant | Hold strategy |
|---|---|---|---|
| Studios | 7.5–9.5% | Young professionals, STR potential | Yield focus |
| 1BR | 6.5–8.5% | Couples, corporate housing | Balanced |
| 2BR | 6–8% | Small families, executives | Appreciation focus |
| 3BR+ | 5.5–7.5% | Families, luxury tenants | Capital preservation |
Dubai Islands vs other artificial island investments
Comparing Dubai’s artificial island developments provides context for investment decisions:
Investment performance comparison (artificial islands)
| Development | Launch period | Price appreciation (launch to 2026) | Current gross yield | Market maturity |
|---|---|---|---|---|
| Palm Jumeirah | 2001–2008 | 180–250% | 4–6% | Mature |
| The World Islands | 2003–2008 | -20% to +50% (variable) | Limited data | Stalled/restarting |
| Palm Jebel Ali | 2002–2008, restarted 2020+ | Early stage | TBD | Development phase |
| Dubai Islands | 2023+ | N/A (too early) | 6–7.5% projected | Pre-launch |
Performance insights:
- Palm Jumeirah: Successful completion and maturation validates artificial island investment thesis
- The World Islands: Demonstrates risks of overly ambitious scope and timing
- Palm Jebel Ali: Shows recovery potential after development hiatus
- Dubai Islands: Benefits from lessons learned and refined master planning
Risk mitigation through island comparison
Lower-risk artificial island investment (Palm Jumeirah model):
- Government-backed developer with completion track record
- Phased development with early infrastructure delivery
- Clear transportation and utility connectivity
- Proven rental market establishment
Higher-risk artificial island investment (The World Islands model):
- Overly ambitious scope relative to market absorption capacity
- Infrastructure completion dependent on full development success
- Limited transportation connectivity
- Speculative rental market assumptions
Dubai Islands positioning: Follows lower-risk Palm Jumeirah model with refined approach based on 20+ years experience.
Financing strategies for Dubai Islands off-plan purchases
Off-plan purchasing requires sophisticated financial planning given 3-4 year payment timelines:
Nakheel payment plan analysis
| Payment milestone | Typical % | Timing | Financing implication |
|---|---|---|---|
| Booking | 5–10% | At SPA signing | Cash requirement |
| Construction milestones | 60–70% | Monthly/quarterly over 36–48 months | Cash flow planning crucial |
| Handover | 25–30% | At completion | Mortgage activation point |
Cash flow optimization strategies:
- Milestone financing: Some UAE banks offer construction-linked loans for qualified buyers
- Bridge financing: Short-term facilities to smooth payment timeline irregularities
- Currency hedging: For international buyers, hedge AED exposure over 3-4 year payment period
Mortgage pre-qualification for handover
Pre-handover mortgage planning:
- Secure mortgage pre-approval before SPA signing
- Verify bank’s lending policy on specific Dubai Islands phases
- Understand valuation methodology for off-plan properties
- Plan for potential LTV changes between purchase and handover
International buyer financing considerations
| Buyer jurisdiction | Typical financing options | Key considerations |
|---|---|---|
| UK buyers | UAE mortgage + UK bridging | Tax implications on currency gains/losses |
| European buyers | UAE mortgage + SIPP/pension funding | Regulatory compliance in home jurisdiction |
| Asian buyers | UAE mortgage + home country facilities | Currency volatility management |
| North American buyers | UAE mortgage + cross-border structures | Tax treaty optimization |
Short-term rental (STR) potential for Dubai Islands
Waterfront location and lifestyle amenities create STR investment opportunities:
STR market development timeline
| Phase | Timeline | STR viability | Revenue potential |
|---|---|---|---|
| Pre-infrastructure | 2024–2026 | Not viable | N/A |
| Early community | 2027–2029 | Limited (no amenities) | AED 150–250/night |
| Lifestyle activation | 2029–2032 | Moderate (beach club + F&B) | AED 200–350/night |
| Full maturity | 2032+ | Strong (full amenity stack) | AED 250–450/night |
STR-optimized investment strategy:
- Target unit types suitable for holiday rentals (1-2 BR with balcony/view)
- Plan for STR furnishing and management costs
- Understand Dubai’s STR licensing requirements (DET permits)
- Model seasonal occupancy patterns (winter peak, summer challenges)
STR yield comparison with long-term rental
Annual revenue comparison (mature market projections):
| Strategy | Occupancy assumption | Gross annual revenue | Net yield after costs |
|---|---|---|---|
| Long-term rental | 95% | AED 85,000 (1BR example) | 5.5–6.5% |
| STR (conservative) | 60% | AED 110,000 | 5–6% |
| STR (optimistic) | 75% | AED 140,000 | 7–8% |
STR cost considerations:
- Furnishing and setup: AED 40,000–60,000 initial investment
- Management fees: 15–25% of revenue vs 5–8% long-term rental
- Maintenance and cleaning: 10–15% of revenue
- Marketing and platform fees: 3–5% of revenue
Environmental and sustainability factors affecting Dubai Islands
Dubai’s sustainability agenda impacts artificial island developments:
Dubai 2040 Urban Master Plan integration
Sustainability requirements:
- Green building standards (minimum Silver rating)
- Renewable energy integration targets
- Water conservation and recycling systems
- Carbon footprint reduction mandates
Investment implications:
- Premium for sustainable buildings in rental market
- Lower operating costs through energy efficiency
- Future-proofing against environmental regulations
- Enhanced resale appeal to ESG-focused buyers
Sea level rise and climate resilience
Engineering considerations:
- Dubai Islands designed with climate change projections
- Elevated construction standards vs historical developments
- Storm water management and flood prevention systems
- Long-term infrastructure maintenance planning
Investment protection:
- Insurance coverage for climate-related risks
- Building design standards exceeding current requirements
- Government commitment to infrastructure protection
- Regional climate adaptation leadership
Exit strategy optimization for Dubai Islands investments
Long development timeline requires sophisticated exit planning:
Assignment market development
| Development phase | Assignment liquidity | Typical premium/discount | Buyer profile |
|---|---|---|---|
| Pre-construction | Limited | Launch price + 0–10% | Sophisticated investors |
| Early construction | Moderate | Launch price + 10–25% | Cash buyers |
| Mid-construction | Active | Launch price + 15–35% | Cash + some mortgage buyers |
| Pre-handover | High | Launch price + 20–40% | Full buyer market |
Assignment strategy optimization:
- Monitor construction milestones for optimal assignment timing
- Market to cash buyers during early phases
- Time assignment to capture infrastructure completion premiums
- Use assignment for portfolio rebalancing without full hold period
Long-term hold vs flip strategy
Long-term hold (7–15 years):
- Benefits from full community maturation
- Captures rental market establishment and growth
- Realizes maximum capital appreciation potential
- Provides lifestyle asset for personal use/family
Medium-term flip (3–7 years):
- Captures initial community establishment premiums
- Avoids market saturation from later phases
- Provides liquidity for portfolio diversification
- Reduces exposure to long-term market cycle risk
Assignment flip (1–3 years):
- Maximizes leverage on construction progress
- Minimizes capital commitment and holding costs
- Captures early buyer premium without completion risk
- Enables rapid portfolio turnover for active investors
For a more mature waterfront alternative with verified Ejari data, compare Dubai Creek Harbour Property Investment.
See Dubai Property Investment Guide and Cost of Buying Property in Dubai.
Frequently Asked Questions
Dubai Islands is predominantly off-plan in 2026, delivered stock is limited, so yield data is early-stage. Developer projections cite 6.0–7.5% gross on apartments, but Market context guidance treats pre-handover yield estimates as speculative. Model conservatively: use comparable Nakheel waterfront communities (Palm Jumeirah apartments at 4–6% gross, older Nakheel stock at 6–7%) and apply an emerging-community vacancy allowance of 8–12% until rental depth builds.
Yes. Dubai Islands (formerly Deira Islands) is a DLD-designated freehold zone. Foreign nationals can purchase off-plan and ready stock with full title deed ownership. The development sits under Nakheel, a government-backed developer with approximately 90% delivery rate based on current market notes Tier 1 data.
Yes. Nakheel rebranded Deira Islands to Dubai Islands as part of a relaunched master plan adding residential, hospitality, and retail across five islands off the Deira coast. The freehold designation and Nakheel ownership persist from the original Deira Islands framework. Investors should search both names in DLD records for historical transaction data.
Both are Emaar/Nakheel waterfront master plans with long-horizon appreciation theses. Creek Harbour has Phase 1 delivered stock with established Ejari data and Emaar's 95% delivery rate. Dubai Islands is earlier-stage with Nakheel's 90% rate and Deira-coast positioning near Dubai Creek and historic Deira. Creek Harbour offers more data for ready-stock investors; Dubai Islands offers earlier entry on off-plan pricing.
Risks include limited rental history on delivered stock, large master plan execution timeline, off-plan capital lock-up of 3–5 years, and competition from Creek Harbour and Palm Jumeirah for waterfront investor attention. Nakheel's 90% delivery rate is strong but below Emaar. Verify RERA escrow for every project, model service charges from comparable Nakheel buildings, and plan a 7–10 year hold for emerging-community liquidity.
Get a Gulf property shortlist
Tell us your budget and market (Dubai, Abu Dhabi, RAK). We reply within one business day with options matched to your goals.