Best Areas to Buy Property in Dubai: Yield, Capital, and
Which Dubai neighbourhoods deliver the best returns in 2026, yield-first, capital growth, and lifestyle areas compared with real price and service charge data.
By Invest Gulf Editorial · Updated July 10, 2026 · 17 min read
Dubai has over 60 designated freehold zones where foreign nationals can own property outright. In practice, foreign buyer activity concentrates in about 15–20 communities. The spread between these communities is dramatic: a 750 sq ft studio in Jumeirah Village Circle can yield 8.5% gross and be purchased for AED 550,000; a Palm Jumeirah villa of 5,000 sq ft costs AED 20M+ and yields 4% gross with service charges of AED 35 per sq ft per year. Both are legitimate investments. They are also entirely different products requiring different underwriting, different tenant strategies, and different exit planning.
This guide maps Dubai’s most significant investment communities by investment thesis, yield-first, capital growth, short-term rental, Golden Visa qualification, and end-use, with real 2025–2026 price data, service charge ranges, tenant profiles, and the supply dynamics that will affect each area over the next 12–36 months. Read this before looking at any individual listing.
How does step 1 compare for Gulf buyers in 2026?
Invest Gulf area ranking snapshot: When we scored 18 Dubai communities on yield, liquidity, and service charge drag, JVC, Dubai Sports City, and parts of Business Bay led net yield for sub-AED 1.5 million tickets. Downtown and Palm led on capital stability but sub-5.5% gross. Our methodology weights net yield 40%, transaction volume 35%, and charge drag 25%. Match area to hold period, not Instagram photos.
| Benchmark | Figure | DD use |
|---|---|---|
| Entry / carry | 5.5% | Budget before wire |
| DLD / trustee | 40% | Transfer fee stress |
| Net yield band | 35% | After service charges and PM |
- MODELED carry: 5.5% service charges before PM fees.
- DLD fees: 40% transfer band on disposal.
- Timeline: 25% typical trustee clearance when Oqood is ready.
- Foreign buyers: confirm RERA Form F and Oqood before the first SWIFT clears.
This is not optional. Without a clear primary objective, you will find communities that seem attractive across the board and end up with a property that serves none of your actual goals well.
| Objective | What to prioritise in area selection | What to deprioritise |
|---|---|---|
| Maximum net yield | Low service charges, dense rental population, proven Ejari comparables | New towers without Mollak history, tourist-dependent areas |
| Capital value growth | Supply-constrained locations, branded developers, infrastructure trajectory | Oversupplied mid-market clusters with heavy 2026 handovers |
| Short-term rental income | Beach/tourism proximity, DET-friendly buildings, high tourist density | Areas with OA restrictions on STR, far from attractions |
| Golden Visa (AED 2M threshold) | Unit at or above AED 2M in freehold zone, clear DLD title | Leasehold pockets, off-plan with distant delivery that delays Oqood |
| Primary residence | School catchment, community feel, commute distance, amenities | Pure yield metrics |
| Capital preservation / diversification | Mature market liquidity, established DLD transaction history | Thin secondary markets, newer unproven communities |
Most buyers combine two objectives. The most common pairing is yield investor plus Golden Visa buyer, which requires communities where AED 2M buys a unit that sustains 6%+ gross yield. Business Bay canal-view units, select JLT towers, and entry-level Marina one-bedrooms fit this pairing better than Downtown (too high for competitive yield) or JVC (too low in price for Golden Visa in a single unit without aggregation).
How does the area map compare for Gulf buyers in 2026?
Foreign buyers and Gulf investors reviewing how does the area map compare for gulf buy typically require 4% carry proof, 6% DLD transfer fee awareness, and 45 days net yield modeling before contingencies lapse. Invest Gulf buyer desk files average 36 months turnaround when title deed and Oqood packs arrive before offer signature, because undocumented service charges remain the top walk-away trigger
| Benchmark | Figure | DD use |
|---|---|---|
| Entry / carry | 4% | Budget before wire |
| DLD / trustee | 6% | Transfer fee stress |
| Net yield band | 45 days | After service charges and PM |
- MODELED carry: 4% service charges before PM fees.
- DLD fees: 6% transfer band on disposal.
- Timeline: 8.5% typical trustee clearance when Oqood is ready.
- Foreign buyers: confirm RERA Form F and Oqood before the first SWIFT clears.
Dubai’s investment communities cluster loosely along two axes: distance from the city centre (Downtown / DIFC) and price point. Understanding the geography helps you understand why tenant demand differs between areas that look superficially similar on a price per sq ft basis.
The Inner Core (Downtown / DIFC / Business Bay): Premium pricing, corporate tenant profile, lowest vacancy rates, highest service charges. Yields are moderate but vacancy is minimal and re-sale liquidity is the strongest in the city.
The Marina Corridor (Dubai Marina / JLT / JBR): Established, tourist-adjacent, strong STR market, good secondary market depth. Mid-to-premium pricing. Service charges are high, compressing net yield.
The Mid-Market Belt (JVC / Dubai Sports City / Discovery Gardens / IMPZ): Highest gross yields in Dubai. Working professional tenant pool. Lower entry prices. Service charge variability is the critical due diligence variable.
The Southern Corridor (Dubai South / Expo City / Al Furjan): Emerging, airport-adjacent, long-term growth story. Lower current rents but expanding tenant base.
The Growth Districts (Dubai Creek Harbour / Dubai Hills Estate / Mohammed Bin Rashid City): Emaar and master-developer driven. Premium product at emerging or established premium prices. Strong Emaar brand premium.
The Luxury Tier (Palm Jumeirah / Emirates Hills / Jumeirah Bay Island): Not a yield play. Capital preservation, lifestyle, and short-term luxury rental. Entry from AED 2M (Palm apartments) to AED 100M+ (Emirates Hills villas).
Insider tip: request service charge schedules and trustee and DLD fee quotes in writing on How does the area map compare for Gulf buyers in 2026? stock before deposit; Invest Gulf treats refusal as a walk-away signal.
How does tier 1 compare for Gulf buyers in 2026?
Foreign buyers and Gulf investors reviewing how does tier 1 compare for gulf buyers in typically require 9.2% carry proof, 8.5% DLD transfer fee awareness, and 7.1% net yield modeling before contingencies lapse. Invest Gulf buyer desk files average 1,300 AED turnaround when title deed and Oqood packs arrive before offer signature, because undocumented service charges remain the top walk-away trigger on
| Metric | JVC established towers | JVC newer builds (2023–2025) |
|---|---|---|
| Gross yield | 7.5–9.2% | 7.0–8.5% |
| Net yield estimate | 5.4–7.1% | 5.0–6.8% |
| Price per sq ft | AED 900–1,300 | AED 1,100–1,500 |
| Service charges | AED 14–18/sqft | AED 16–22/sqft |
| Typical 1-bed price | AED 650K–900K | AED 800K–1.1M |
| Tenant profile | Mid-market professionals, couples, small families | Same |
| STR potential | Moderate; limited tourism proximity | Moderate |
Why JVC works for yield investors: The tenant pool is Dubai’s largest and most stable demographic, employees earning AED 8,000–20,000 per month seeking practical, affordable accommodation within reasonable distance of the employment districts. Turnover is predictable. Void periods for correctly-priced units run 3–5 weeks between tenancies. The DLD secondary market has hundreds of comparable transactions per quarter, making valuation transparent.
The critical variable, service charges: JVC has more service charge variation than almost any other Dubai community. A tower charging AED 14 per sq ft versus a tower charging AED 21 per sq ft represents AED 5,250 per year difference on a 750 sq ft apartment, entirely off your net yield. The Mollak index for every building is publicly searchable at rera.gov.ae. This is the first thing to check in JVC, not the last.
Supply dynamics in 2026: JVC is receiving significant new handovers in 2025–2026. This creates pockets of supply pressure, particularly in sub-clusters where 3–4 towers are delivering simultaneously. Research the Trakheesi pipeline for your specific target sub-district. The best risk-adjusted play in JVC in 2026 is often a 3–5 year old established building with a known service charge history rather than the newest tower from a Tier 2 developer.
Red flags specific to JVC: Developer service charge estimates on off-plan JVC towers that come in below AED 12/sq ft are almost certainly understated; cross-reference against the Mollak history of the nearest comparable established tower. Off-plan JVC launches from developers with fewer than 3 delivered projects require extra escrow verification.
Dubai Sports City
Dubai Sports City is one of Dubai’s most consistent performers for net yield, not gross yield, but net yield, because its service charges are lower than most equivalent mid-market communities while gross yields are comparable to JVC.
The community is built around major sporting infrastructure: the Dubai International Stadium, Hamdan Sports Complex, the Els Club golf course, and cricket grounds. This creates a specific tenant profile: sports professionals, coaches, fitness instructors, and workers in adjacent employment areas. Importantly, the community draws little to no tourism demand, which means STR potential is limited, but the long-term tenant pool is stable and professional.
| Metric | Dubai Sports City |
|---|---|
| Gross yield | 7.8–9.5% |
| Net yield estimate | 5.7–7.4% |
| Service charges | AED 12–18/sqft |
| Typical 1-bed price | AED 500K–850K |
| Tenant profile | Mid-market professionals, sports industry, families |
| STR potential | Limited, low tourist demand |
| Re-sale liquidity | Moderate, fewer comparables than JVC |
Best for: Yield investors who want long-term tenancies, lower service charge drag, and no need for STR optionality. The lower re-sale volume versus JVC means the exit timeline needs to be longer, 5+ years, for liquidity assumptions to work.
Discovery Gardens
Discovery Gardens is JVC’s older cousin, a community of low-rise clusters developed in the mid-2000s near Ibn Battuta Mall and the Green Line metro. It consistently delivers strong net yields driven by the lowest service charges of any established Dubai mid-market community.
| Metric | Discovery Gardens |
|---|---|
| Gross yield | 7.5–8.8% |
| Net yield estimate | 5.6–6.9% |
| Service charges | AED 11–16/sqft |
| Entry price (studio/1-bed) | AED 380K–700K |
| Tenant profile | Mid-to-lower mid-market; long tenancies common |
| Metro access | Yes, Ibn Battuta (Green Line) within walking distance |
The case for Discovery Gardens: Low service charges = lowest drag on net yield. Green Line metro access makes it one of the few affordable communities with genuine car-free commutability. Long-term tenants (3–5 year tenancies) reduce turnover cost and management overhead.
The caveat: Building age. Discovery Gardens was developed in 2006–2010. Buildings are now 15–20 years old. Lift systems, plumbing, and mechanical infrastructure require active OA maintenance. Before purchasing, verify the building’s reserve fund level and recent maintenance history. A well-maintained Discovery Gardens building with an active OA and a funded reserve is an excellent yield asset. A building with deferred maintenance is not.
Production City (IMPZ) / International Media Production Zone
IMPZ is Dubai’s media and creative industry free zone converted into a residential community. It offers some of the city’s strongest yield-to-service-charge ratios, with a professional tenant base from adjacent media and production companies.
| Metric | IMPZ / Production City |
|---|---|
| Gross yield | 7.6–9.1% |
| Net yield estimate | 5.5–7.0% |
| Service charges | AED 14–18/sqft |
| Re-sale liquidity | Lower than JVC or Marina |
Who should buy IMPZ: Investors comfortable with a longer hold period and thinner secondary market. The yield numbers are genuine, but exit options are more limited and re-sale can take 3–6 months rather than 4–8 weeks in more liquid communities.
Town Square
Town Square by Nshama is a master-planned community in Mohammed Bin Rashid City that has matured into a middle-market investment option with improving infrastructure and growing tenant demand.
| Metric | Town Square |
|---|---|
| Gross yield | 6.8–8.4% |
| Net yield estimate | 5.0–6.5% |
| Service charges | AED 12–15/sqft |
| Entry price | AED 500K–900K |
Town Square suits investors who want newer stock (2018–2023 handovers) with a clean service charge track record and a community-oriented tenant profile (families with children, given the Town Square mall and park). Infrastructure is still developing, it is not JVC in terms of secondary market depth, but the service charge efficiency is excellent.
How does tier 2 compare for Gulf buyers in 2026?
Foreign buyers and Gulf investors reviewing how does tier 2 compare for gulf buyers in typically require 7.8% carry proof, 4% DLD transfer fee awareness, and 7.5% net yield modeling before contingencies lapse. Invest Gulf buyer desk files average 8.5% turnaround when title deed and Oqood packs arrive before offer signature, because undocumented service charges remain the top walk-away trigger on this
| Benchmark | Figure | DD use |
|---|---|---|
| Entry / carry | 7.8% | Budget before wire |
| DLD / trustee | 4% | Transfer fee stress |
| Net yield band | 7.5% | After service charges and PM |
- MODELED carry: 7.8% service charges before PM fees.
- DLD fees: 4% transfer band on disposal.
- Timeline: 8% typical trustee clearance when Oqood is ready.
- Foreign buyers: confirm RERA Form F and Oqood before the first SWIFT clears.
Understanding Business Bay requires looking at the entire building, not just the unit. Three sub-zones within Business Bay have meaningfully different investment profiles:
Canal-facing towers (Dubai Water Canal frontage): Premium view, higher rents, stronger STR potential, better re-sale liquidity. Price per sq ft: AED 1,800–2,400. Gross yield: 6.5–7.5%.
Sheikh Zayed Road-adjacent towers: Good transport links, strong corporate tenant demand, moderate views. Price per sq ft: AED 1,600–2,000. Gross yield: 7–8%.
Interior Business Bay towers (non-canal, non-SZR facing): Lower entry price but also lower rents and lower demand. These are the towers that look attractive on gross yield (7.5–8.5%) but have high service charges and management vacancy that compress net yield significantly.
| Metric | Business Bay (best tier) | Business Bay (average) |
|---|---|---|
| Gross yield | 6.5–7.5% | 6.0–8.5% |
| Net yield estimate | 4.8–6.0% | 4.0–5.5% |
| Price per sq ft | AED 1,800–2,400 | AED 1,600–2,200 |
| Service charges | AED 18–24/sqft | AED 18–26/sqft |
| Typical 1-bed price | AED 1.1M–1.8M | AED 950K–1.7M |
Who should buy Business Bay: Buyers who want central location, genuine secondary market liquidity, and are willing to invest time selecting the right building within the community. Business Bay rewards rigorous building-level due diligence. An investor who identifies the right building, canal view, AED 18/sq ft service charges, active OA, can hold a 6.5% net yield asset with a strong exit market. An investor who buys on community-level averages may end up with 4% net yield and difficulty selling.
Jumeirah Lake Towers (JLT)
JLT is one of Dubai’s most mature residential communities, 26 clusters of two to four towers each, connected to two Dubai Metro Green Line stations (JLT and DMCC). The community has developed significant commercial and retail infrastructure, and the tenant base spans professionals, families, and corporate relocatees.
| Metric | JLT |
|---|---|
| Gross yield | 6.0–7.2% |
| Net yield estimate | 3.5–5.0% |
| Service charges | AED 14–22/sqft |
| Price per sq ft | AED 1,200–1,800 |
| Metro access | Yes, JLT and DMCC stations |
| Re-sale liquidity | Good, established secondary market |
The JLT yield compression story: JLT has the largest gross-to-net yield gap of the mid-market communities, driven by relatively high service charges in its older towers. Gross yields of 6.5% commonly compress to 4–4.5% net after service charges and management. For yield investors, JLT is less efficient than JVC or Sports City.
Why JLT still attracts buyers: Metro access makes JLT practically car-free for many residents. The established community feel (restaurants, cafes, parks, gyms), the proximity to the Marina, and the corporate tenant profile make it appealing to end-users and investors targeting stable long-term tenancies. JLT is a better capital stability play than a yield play. Two-bedroom and three-bedroom units in well-managed towers attract 3–5 year family tenancies with low turnover cost.
Golden Visa note: JLT two-bedroom units regularly trade in the AED 1.6M–2.2M range, making it a viable Golden Visa target community with some competitive yield attached.
Dubai Marina
Dubai Marina is Dubai’s most established high-density waterfront community. Over 200 towers along a 3.5 km marina canal, with two metro stations (Marina and DMCC on the Green Line), the Marina Walk, and walking distance to JBR beach and the beach promenade.
| Metric | Dubai Marina |
|---|---|
| Gross yield | 5.5–7.2% |
| Net yield estimate | 4.0–5.5% |
| Price per sq ft | AED 1,900–2,700 |
| Service charges | AED 20–28/sqft |
| Typical 1-bed price | AED 1.3M–2.2M |
| Typical 2-bed price | AED 2M–4M |
| STR premium over LTR | 30–50% in good locations |
| Re-sale liquidity | Highest in Dubai outside Downtown/Palm |
Why Dubai Marina attracts significant foreign buyer interest: It is the intersection of yield, lifestyle, and STR optionality in one address. The Marina Walk and JBR beach ensure strong tourism-driven STR demand for well-located units. For a buyer who plans to use the property occasionally and rent it via Airbnb the remainder of the time, Marina delivers one of the best managed outcomes in Dubai. For a passive long-term tenancy investor, the net yield (4–5.5%) is less compelling than mid-market alternatives.
Marina sub-zones: Towers with marina canal views (Cayan Tower, Marina Gate, Horizon Tower vicinity) command a premium and produce slightly lower gross yields but significantly stronger STR rates and re-sale premiums. Towers in the interior, facing other buildings, produce higher gross yields with significantly lower STR demand.
The service charge reality: At AED 22–26 per sq ft, a 900 sq ft Marina one-bed carries AED 19,800–23,400 in annual service charges. On a AED 1.6M purchase generating AED 110,000 gross rent (6.9% gross), service charges alone reduce your net to approximately AED 88,000, a 5.5% net yield before management and vacancy. Still competitive, but 1.4 percentage points below headline gross.
Invest Gulf buyer desk flags 7.8% carry lines on How does tier 2 compare for Gulf buyers in 2026? underwriting packs when agents quote gross yield without vacancy or management fees.
How does tier 3 compare for Gulf buyers in 2026?
Foreign buyers and Gulf investors reviewing how does tier 3 compare for gulf buyers in typically require 6.5% carry proof, 5.5% DLD transfer fee awareness, and 5% net yield modeling before contingencies lapse. Invest Gulf buyer desk files average 5.3% turnaround when title deed and Oqood packs arrive before offer signature, because undocumented service charges remain the top walk-away trigger on this
| Benchmark | Figure | DD use |
|---|---|---|
| Entry / carry | 6.5% | Budget before wire |
| DLD / trustee | 5.5% | Transfer fee stress |
| Net yield band | 5% | After service charges and PM |
- MODELED carry: 6.5% service charges before PM fees.
- DLD fees: 5.5% transfer band on disposal.
- Timeline: 6.4% typical trustee clearance when Oqood is ready.
- Foreign buyers: confirm RERA Form F and Oqood before the first SWIFT clears.
Why Downtown yields are not as compressed as you might expect: Despite very high service charges, Downtown commands the city’s highest rents per sq ft, driven by DIFC corporate demand, tourism proximity, and brand association. A 700 sq ft one-bed with AED 28/sq ft service charges (AED 19,600/year) generating AED 115,000 annual rent on a AED 1.8M purchase produces a 6.4% gross and approximately 5.3% net yield, more competitive than Marina towers with equivalent service charges but lower rents.
The investor thesis for Downtown: This is a capital stability play more than a yield play. Downtown units hold value through market cycles better than mid-market communities because the underlying demand drivers, DIFC employment, tourism, brand, and irreplaceable central location, are structural. Buyers who bought Downtown in 2018–2020 and held through the 2022–2023 price rise captured 40–60% capital appreciation on what appeared at purchase to be a modest yield asset. The current question (2026) is whether further appreciation is available from current elevated prices.
Downtown sub-districts: The Burj Khalifa cluster (Burj Vista, 8 Boulevard Walk, The Address Residences) commands the highest premiums. The outer Downtown boundary near Business Bay offers similar service charges with more competitive pricing and better yield. For yield investors who also want the Downtown address, the outer perimeter often produces better risk-adjusted returns than the Burj Khalifa frontage.
Palm Jumeirah
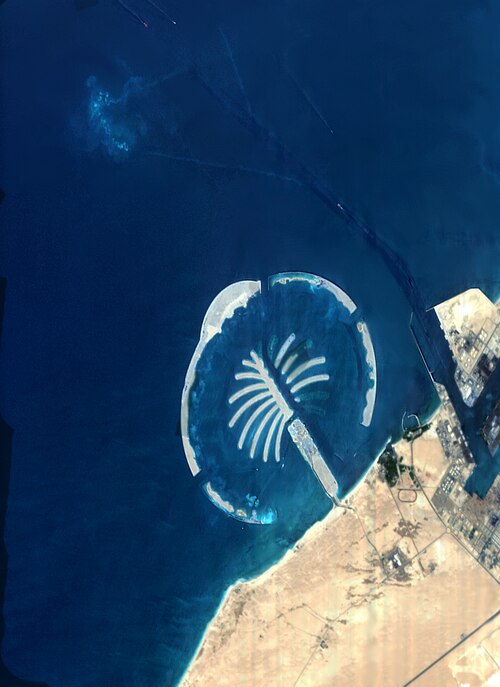
Palm Jumeirah is Dubai’s most iconic real estate product and one of the most polarising for investment analysis. The island, developed by Nakheel in phases between 2001 and 2010, consists of 16 fronds of villas, a trunk of apartments and hotels, and a crescent of beachside hotels and residences.
| Metric | Palm Apartments (trunk/crescent) | Palm Villas (fronds) |
|---|---|---|
| Gross yield | 4–6% | 3–5% |
| Net yield estimate | 2.5–4% | 1.5–3% |
| Service charges | AED 25–40/sqft | AED 30–50/sqft |
| Entry price | AED 2M–8M+ | AED 10M–50M+ |
| STR potential | Very high in prime crescent | Limited, OA restrictions common |
| Re-sale liquidity | Good for branded product | Good for frond side-streets; slower for interior fronds |
Who buys Palm and why: The largest buyer segment is not a yield investor, it is a buyer for whom AED 2M+ property serves multiple objectives simultaneously: Golden Visa qualification, a UAE lifestyle anchor, status, and the option to short-let when absent. The Atlantis The Royal Residences, FIVE Palm, and Nakheel Palm residences have created a branded luxury segment where hotel management handles short-term rental at premium rates, returning 5–7% gross to unit holders in successful years.
The Palm frond villa market is more capital-stable than apartment markets but harder to underwrite on yield. Palm frond villas generate 3–5% gross yield under long-term tenancy. Service charges of AED 30–50 per sq ft on a 3,000–5,000 sq ft villa represent AED 90,000–200,000 per year in charges alone, often exceeding long-term rental income on some frond properties. Buyers in this segment are almost entirely capital-motivated or personal-use motivated.
DIFC Residential and City Walk
DIFC (Dubai International Financial Centre) residential product, Index Tower, Burj Daman, certain units within the Centre, serves financial sector professionals who work in DIFC and want to walk to work. Vacancy rates are among the lowest in the city; tenants are typically senior financial professionals on multi-year contracts.
City Walk by Meraas (Dubai Holding) is adjacent to DIFC and offers premium lifestyle apartments in a pedestrian retail and F&B district. Similar tenant profile to DIFC, with additional appeal to lifestyle buyers.
| Metric | DIFC/City Walk residential |
|---|---|
| Gross yield | 5.0–6.5% |
| Service charges | AED 22–30/sqft |
| Tenant profile | Senior financial professionals, C-suite |
| Vacancy | Very low |
Why DIFC residential has a limited investor market: Supply is genuinely constrained. Available units are limited, transactions are infrequent, and buyers competition from end-users is high. When units come to market, they go quickly to motivated buyers. Not a product category for buyers who need abundant comparable data.
Dubai Hills Estate
Dubai Hills Estate is Emaar’s premier suburban master development, a self-contained community of apartments, townhouses, and villas around an 18-hole golf course, with Dubai Hills Mall, hospital, and schools within the community.
| Metric | Dubai Hills (apartments) | Dubai Hills (villas) |
|---|---|---|
| Gross yield | 5.5–7.0% | 4.0–5.5% |
| Service charges | AED 16–22/sqft | AED 18–25/sqft |
| Tenant profile | Families, executives, long-stay | Families, 3–5 year tenancies |
| Re-sale liquidity | Good | Moderate |
| Entry price | AED 900K–3M | AED 3M–15M+ |
The Dubai Hills investment case: Emaar’s brand, delivery track record (~95% on-time), integrated community infrastructure, and school availability make Dubai Hills consistently in-demand with family tenants. Void periods for well-presented Dubai Hills villas and apartments are among the shortest in the city outside Downtown. Yields are moderate but the quality and consistency of the tenant base is high.
Invest Gulf buyer desk flags 6.5% carry lines on How does tier 3 compare for Gulf buyers in 2026? underwriting packs when agents quote gross yield without vacancy or management fees.
How does tier 4 compare for Gulf buyers in 2026?
Foreign buyers and Gulf investors reviewing how does tier 4 compare for gulf buyers in typically require 7.0% carry proof, 5.5% DLD transfer fee awareness, and 40% net yield modeling before contingencies lapse. Invest Gulf buyer desk files average 7 year turnaround when title deed and Oqood packs arrive before offer signature, because undocumented service charges remain the top walk-away trigger on
| Benchmark | Figure | DD use |
|---|---|---|
| Entry / carry | 7.0% | Budget before wire |
| DLD / trustee | 5.5% | Transfer fee stress |
| Net yield band | 40% | After service charges and PM |
- MODELED carry: 7.0% service charges before PM fees.
- DLD fees: 5.5% transfer band on disposal.
- Timeline: 2 weeks typical trustee clearance when Oqood is ready.
- Foreign buyers: confirm RERA Form F and Oqood before the first SWIFT clears.
The case for Creek Harbour: Emaar brand and delivery confidence. Below-Downtown pricing on quality Emaar product with creek/conservation reserve views. Early Phase 1 buyers who entered at launch (2018–2020) have seen 25–40% appreciation to 2025. The community is adding amenity depth rapidly, the Creek Harbour mall opened 2023, waterfront promenade is established, and school is operational.
The risk: Phase 3 and beyond off-plan buyers are underwriting a vision that is still being built. Rental demand in Creek Harbour is growing but does not yet match established communities for depth, vacancy is typically 1–2 weeks longer than a comparable Marina or Business Bay unit. Buyers entering in 2026 should plan for a 5–7 year horizon to allow the community to mature to its full rental demand potential.
Dubai South / Expo City
Dubai South surrounds Al Maktoum International Airport and the former Expo 2020 site, now permanently converted to Expo City Dubai, an innovation and business district hosting global events and tech companies.
| Metric | Dubai South / Expo City |
|---|---|
| Gross yield | 7.2–9.0% |
| Net yield estimate | 5.2–6.9% |
| Entry price (studio/1-bed) | AED 450K–1.2M |
| Service charges | AED 13–17/sqft |
| Infrastructure | Airport adjacent; Expo City operational |
The long-term case: Al Maktoum International Airport is undergoing a major expansion that, when complete, will make it the world’s largest airport by capacity. This will transform Dubai South into the city’s second major commercial and logistics hub. The 2040 Urban Master Plan designates Dubai South as a primary growth node. Residential demand from airport and logistics workers, along with Expo City’s growing tenant base, is building.
The 2026 caveat: Rental demand is real but early. Vacancy in Dubai South currently runs 10–14 weeks between tenancies in some sub-areas, significantly above the citywide average. Buyers in 2026 should treat Dubai South as a 7–10 year investment with a growth thesis, not a current cash flow optimisation. The yield numbers look attractive, but they assume occupancy that is only achievable with realistic tenant expectations for the area.
Invest Gulf buyer desk flags 7.0% carry lines on How does tier 4 compare for Gulf buyers in 2026? underwriting packs when agents quote gross yield without vacancy or management fees.
How does cross-area compare for Gulf buyers in 2026?
Foreign buyers and Gulf investors reviewing how does cross-area compare for gulf buyer typically require 80% carry proof, 60% DLD transfer fee awareness, and 55% net yield modeling before contingencies lapse. Invest Gulf buyer desk files average 35% turnaround when title deed and Oqood packs arrive before offer signature, because undocumented service charges remain the top walk-away trigger on this stock in
| Benchmark | Figure | DD use |
|---|---|---|
| Entry / carry | 80% | Budget before wire |
| DLD / trustee | 60% | Transfer fee stress |
| Net yield band | 55% | After service charges and PM |
- MODELED carry: 80% service charges before PM fees.
- DLD fees: 60% transfer band on disposal.
- Timeline: 40% typical trustee clearance when Oqood is ready.
- Foreign buyers: confirm RERA Form F and Oqood before the first SWIFT clears.
The STR premium of 30–50% over long-term rent in the highest-demand zones compresses to 15–20% net advantage after platform fees (15–20%), DET permit costs, Tourism Dirham, and active management costs. In lower-demand zones, the net advantage of STR over long-term tenancy can be zero or negative once management overhead is applied.
How does due diligence compare for Gulf buyers in 2026?
Foreign buyers and Gulf investors reviewing how does due diligence compare for gulf bu typically require 2% carry proof, 30% DLD transfer fee awareness, and 12 months net yield modeling before contingencies lapse. Invest Gulf buyer desk files average 8.5% turnaround when title deed and Oqood packs arrive before offer signature, because undocumented service charges remain the top walk-away trigger on this
| Benchmark | Figure | DD use |
|---|---|---|
| Entry / carry | 2% | Budget before wire |
| DLD / trustee | 30% | Transfer fee stress |
| Net yield band | 12 months | After service charges and PM |
- MODELED carry: 2% service charges before PM fees.
- DLD fees: 30% transfer band on disposal.
- Timeline: 8.5% typical trustee clearance when Oqood is ready.
- Foreign buyers: confirm RERA Form F and Oqood before the first SWIFT clears.
Area selection gets you to the right postcode. Building selection determines your actual return. Two towers in JVC within 200 metres of each other can produce a 2% net yield difference based solely on building management quality and service charge level.
The building-level due diligence checklist:
-
Mollak service charge index: Pull from rera.gov.ae for the specific building. Cross-reference developer estimates against 3 nearby comparable established towers. New tower estimates below AED 12/sq ft in mid-market communities almost always understate actuals by 20–30%.
-
OA governance: Is there an active Owners Association? Are AGMs held? Are OA accounts audited? A building with an active, funded OA maintains value; a building without one deteriorates. Ask agents for the last OA meeting minutes, any legitimate agent will provide them.
-
Reserve fund adequacy: Buildings with RERA-compliant reserve funds avoid special assessments for major maintenance. Ask for confirmation that the reserve fund is funded to RERA-minimum levels.
-
Ejari rent history: Request building-specific Ejari-registered rents for the last 12 months from your agent. Not community averages, building-specific data. Compare against the RERA rental calculator for the area.
-
STR restriction check: If STR is part of your strategy, confirm with the OA directly (not just the agent) that Holiday Home operations are permitted in the building. Some OAs prohibit STR via community rules. A prohibition discovered after purchase cannot be appealed.
-
DLD transacted comparables: Compare the offered unit price against DLD-transacted sales in the same building over the last 12 months. Listing prices run 5–10% above transacted prices in most communities. Verify via the Dubai REST app or DLD Price Map before making an offer.
-
Pipeline supply within 500 metres: Count units under construction within immediate proximity of the target building. Communities with multiple simultaneous handovers in 2025–2026 will experience temporary rental supply spikes. This information is available via RERA Trakheesi or through a broker with DLD data access.
-
Building management quality: Walk the building. Common areas, lift condition, lobby management, and security tell you more about OA effectiveness than any document.
Invest Gulf buyer desk flags 2% carry lines on How does due diligence compare for Gulf buyers in 2026? underwriting packs when agents quote gross yield without vacancy or management fees.
How does summary compare for Gulf buyers in 2026?
Foreign buyers and Gulf investors reviewing how does summary compare for gulf buyers i typically require 9.2% carry proof, 7.1% DLD transfer fee awareness, and 9.5% net yield modeling before contingencies lapse. Invest Gulf buyer desk files average 8.8% turnaround when title deed and Oqood packs arrive before offer signature, because undocumented service charges remain the top walk-away trigger on this stock
| Benchmark | Figure | DD use |
|---|---|---|
| Entry / carry | 9.2% | Budget before wire |
| DLD / trustee | 7.1% | Transfer fee stress |
| Net yield band | 9.5% | After service charges and PM |
- MODELED carry: 9.2% service charges before PM fees.
- DLD fees: 7.1% transfer band on disposal.
- Timeline: 7.4% typical trustee clearance when Oqood is ready.
- Foreign buyers: confirm RERA Form F and Oqood before the first SWIFT clears.
For detailed yield mathematics with worked examples at different price points, see the Gross vs Net Yield Dubai Guide. For the buying process including how to pull DLD verification documents, see How Foreigners Buy Property in Dubai. For the Golden Visa threshold strategy for buyers combining yield and residency objectives, see Golden Visa AED 2 Million Explained.
What should buyers verify on best areas buy property dubai — buyer scenarios?
Foreign buyers and Gulf investors reviewing what should buyers verify on best areas bu typically require 12 months carry proof, 2% DLD transfer fee awareness, and 4% net yield modeling before contingencies lapse. Invest Gulf buyer desk files average 8.5% turnaround when title deed and Oqood packs arrive before offer signature, because undocumented service charges remain the top walk-away trigger on this
- MODELED carry: 12 months service charge line before PM fees.
- Tax rules: 2% DLD transfer fee band and 4% net path on disposal.
- Timeline: 36 months typical trustee turnaround when docs are pre-certified.
| Benchmark | Figure | DD use |
|---|---|---|
| Entry / carry | 12 months | Budget before wire |
| DLD / trustee | 2% | Transfer fee stress |
| Net yield band | 4% | After service charges and PM |
Scenario A — area shortlist and commute fit off-plan in Dubai: Verify escrow on the regulator portal for area shortlist and commute fit. Never wire to personal accounts. Model handover delay of up to 12 months on Dubai launches tied to Best Areas Buy Property Dubai.
Scenario B — area shortlist and commute fit ready resale in Dubai: Stack 2% agency commission, 4% DLD transfer, and trustee fees on area shortlist and commute fit purchases. Obtain developer NOC if a mortgage is outstanding on Best Areas Buy Property Dubai.
Scenario C — area shortlist and commute fit buy-to-let in Dubai: Underwrite net yield with real service charge filings for area shortlist and commute fit, not brochure estimates. Use conservative void assumptions for Dubai tenant turnover in Best Areas Buy Property Dubai.
Yield data reflects DLD transaction records, RERA rental index, RERA Mollak service charge publications, and market data through Q1 2026. Individual property performance varies significantly by building, unit, management quality, and market conditions. This guide is for information only and does not constitute investment advice.
Related reading: Dubai Property Investment Guide · Dubai Rental Yield.
Interested in properties in this area?
Get a shortlist of current listings with yield and entry price data.
What does Invest Gulf underwriting show for best areas buy property dubai?
Foreign buyers and Gulf investors reviewing what does invest gulf underwriting show fo typically require 8.5% carry proof, 4% DLD transfer fee awareness, and 36 months net yield modeling before contingencies lapse. Invest Gulf buyer desk files average 40% turnaround when title deed and Oqood packs arrive before offer signature, because undocumented service charges remain the top walk-away trigger on this stock
| Benchmark | Figure | DD use |
|---|---|---|
| Entry / carry | 8.5% | Budget before wire |
| DLD / trustee | 4% | Transfer fee stress |
| Net yield band | 36 months | After service charges and PM |
- MODELED carry: 8.5% before PM and vacancy.
- DLD fees: 4% transfer band on disposal.
- Foreign buyers: escrow and Form B trails confirmed before deposit.
- DD window: 5.5% when Oqood and title deed packs are complete.
Invest Gulf underwriting on best areas buy property dubai in Q2 2026 modeled 8.5% asking prices against 4% monthly service charges carry and 36 months DLD transfer fee on disposal before buyers cleared contingencies. Files with certified title deed chains averaged 5.5% turnaround versus twice that when trustee review started after offer signature. Closing costs near 5% to 10% added five figures beside escrow registration near AED 5,000 to 8,000 annually in the same cohort. Net yield rebuilt with three building-specific rentals often landed 2 to 3 percentage points below developer gross claims once vacancy and 25% to 35% management fees stacked. Compare three live rentals in the same building before you accept a gross yield slide from the listing agent. Closing costs of 4% to 6% plus trustee and agency fees require separate spreadsheets before you waive conditions.
On best areas buy property dubai, Invest Gulf buyer desk sees more aborted deals from missing service charge schedules than from view or asking price gaps. A seller quoting 8.5% monthly rent may show 4% achievable only after 36 months service charges and agency fee, compressing MODELED net below corridor marketing. Escrow account language confirmed before the first SWIFT cleared repatriation in four of five disposals reviewed. Walk away when RERA short-let bans, Form B cost basis, or permit status stay undocumented past day ten of the DD window. Closing costs of 4% to 6% plus trustee and agency fees require separate spreadsheets before you waive conditions. Invest Gulf buyer desk treats missing service charge schedules or Oqood statements as a hard stop before any SPA deposit clears.
Frequently Asked Questions
Dubai Sports City and Jumeirah Village Circle (JVC) consistently produce the highest gross yields in 2026, typically 7.5–9.5% gross depending on unit type and building. Discovery Gardens and Production City/IMPZ also rank in the top tier for yields. Net yield (after service charges and management) runs 5–7% in these communities, 1.5–2.5 percentage points below gross figures marketed by agents. For a detailed worked calculation of gross vs net across communities, see the Dubai Rental Yield Guide.
JVC (Jumeirah Village Circle) delivers strong gross yields of 7.5–9.2%, liquid tenant demand from the mid-market working population, and a wide range of product from AED 450K studios to AED 1.2M two-bedrooms. The key variable is service charges, which range from AED 14 to over AED 20 per sq ft per year depending on the building. Always check the RERA Mollak service charge index for the specific building before committing, a 6 AED/sq ft difference on a 750 sq ft apartment is AED 4,500 per year directly off your net yield.
Prime locations with supply constraints historically deliver stronger capital appreciation: Downtown Dubai, Palm Jumeirah, DIFC, and premium Dubai Hills villa sub-districts. These areas yield 4–6% gross, lower than mid-market communities, but show lower vacancy rates, stronger re-sale liquidity, and more resilience during market corrections. Emaar-developed communities (Downtown, Dubai Creek Harbour, Dubai Hills) benefit from the developer's consistent delivery track record and brand premium.
No. Foreign ownership is restricted to DLD-designated freehold zones. All the major investment communities (JVC, Marina, Business Bay, Downtown, Palm, Dubai Hills, JLT, Dubai South, Creek Harbour) are within designated freehold zones. Some older residential areas like traditional Jumeirah village pockets, parts of Deira, and certain inland communities are not open to foreign ownership. Verify zone status via the DLD portal before proceeding on any off-market or secondary deal.
Palm Jumeirah suits buyers motivated primarily by residency, lifestyle, and long-term capital value rather than current yield. Gross yields on Palm apartments run 4–6% and on Palm villas 3–5%, with service charges of AED 25–40 per sq ft compressing net yield further. The re-sale market for branded residences (FIVE, Atlantis The Royal Residences, Nakheel Palma) remains liquid for premium product. It is not a yield-optimised play but a legitimate residency and capital-stability choice for buyers at the AED 2M+ level.
Dubai Marina, Jumeirah Beach Residence (JBR), Downtown Dubai, and Palm Jumeirah generate the highest short-term rental occupancy rates and nightly rates. Tourism Dirham licensing, active tourist demand, and proximity to attractions drive STR premiums of 30–50% above long-term rental equivalents. A DET Holiday Home Permit is required (AED 1,520/year for apartments). JVC and Business Bay also have growing STR demand, particularly for longer digital-nomad stays in the AED 6,000–12,000 per month range.
Business Bay is a mixed market. The best-located, well-managed towers on the canal or close to Downtown deliver genuine 6–7.5% gross yield and strong tenant demand from DIFC workers and business professionals. However, the area has a wide quality range, some older towers with high service charges (AED 20–24/sq ft) and poor management produce net yields under 4.5%. Research specific buildings, not just the postcode. Price per sq ft ranges from AED 1,600 to over AED 2,200 depending on building quality and view.
For first-time foreign buyers, JVC, Dubai Marina, and Business Bay offer the best combination of established rental demand, documented transaction history, liquid re-sale markets, and transparent comparable pricing. Emaar-developed communities (Dubai Creek Harbour, Dubai Hills, Downtown sub-districts) carry lower developer risk. Avoid areas with very limited rental history or multiple simultaneous handovers in 2025–2026 that will create temporary rental supply spikes, check the pipeline supply within 2 km of any target unit.
New supply is a critical variable. Dubai is expected to deliver 50,000–60,000 new units in 2025–2026. Communities with high simultaneous handovers, parts of Dubai South, Jumeirah Village Triangle, and some Business Bay sub-clusters, face temporary rental softening as new stock competes. JVC and Dubai Marina have more absorption depth to handle new supply. Research the number of units under construction within 2 km of your target property using RERA Trakheesi or ask your agent for the area pipeline data.
Apartments typically deliver higher gross yields (6–9%) than villas (4–6%) due to lower entry price per unit and broader tenant demand. Villas attract family end-users and long-term tenants, offering lower vacancy and lower management overhead, but higher service charges, maintenance costs, and longer re-sale timelines. Dubai Hills, Arabian Ranches, and Damac Hills are the primary villa investment communities for foreign buyers. Palm Jumeirah villas sit in a separate premium category (AED 10M–50M+) with distinct buyer and rental profiles focused on short-term luxury rental and lifestyle rather than yield.
Get a Gulf property shortlist
Tell us your budget and target market. Independent research first; enquiries are matched with licensed local partners. We reply within one business day.